project two - trivial pursuits
LearnedLeague is a website where you can play online head-to-head trivia matches against luminaries like Ken Jennings, Brad Rutter, and Mick Mulvaney. I’ve been playing there since 2014, and I’m pretty good, but I want to be better. Maybe I can up my game.. with data science!?
Half of the game is about getting the answers right. The other half is predicting what your opponent is going to know. You don’t just need to know the answer; you need to be able to estimate how hard a question is, so you can assign your opponent more points for the hard ones and fewer points for the easy ones.
I’m not going to try to use machine learning to answer the questions themselves. That’s been done, by people much smarter than me, and anyway it would be cheating. Instead, I want to predict how hard a question is. And I’m gonna need some data for that!
the great.. e-scrape? is that anything?
Luckily for me, LearnedLeague match pages are rendered in pretty straightforward HTML that makes them easy to parse with the Beautiful Soup screen-scraper package. (Even the URL structure is easy to automate.) I was only interested in grabbing a few things from each page:
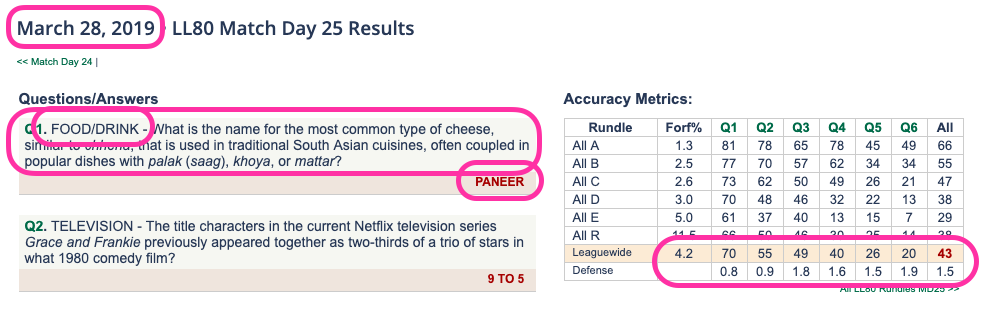
The most important data points are the question text, category, and the percentage of people across the league that got each question correct (the numbers in the salmon-colored bar next to “Leaguewide” above.) I also grabbed the answer, the date, the average question defense (points assigned), forfeit rate (percentage of people who failed to submit anything at all), and the “A” (top-tier) and “E” (bottom-tier) correct rates (not circled above) for good measure.
All questions from season 52 (early 2012) to season 80 (ended last month) are online. However, the match pages for seasons 52 through 59 are formatted somewhat differently, and would require building a separate scraper function; and anyway 21 seasons seemed like plenty.
I wound up with a dataset of 3,150 high-quality trivia questions, along with the category, date, and percentage of people who answered each one correctly.
Inspecting my data for quality problems, I only found a single, easily fixed issue: the defense scores for season 63, match 23 appeared 100 times higher than they should have been. Everything else looked great!
paramity (parameter calamity)
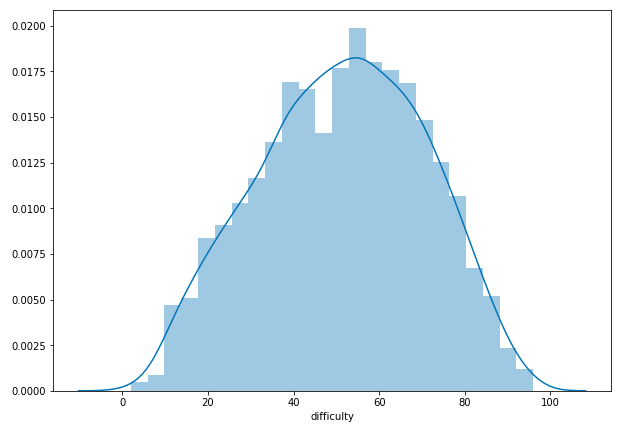
Data in hand, I now had to think about what features I would use in my difficulty-predicting model. The first thing I did was subtract my percent-correct number from 100 to get a percent-_wrong_ number, or “difficulty,” on a scale from 0 to 100 (actually 2 to 96).1
Thorsten aims for an average overall get-rate of 50%; the average in my data was 48.7% (difficulty of 51.3), which is pretty close! And even better, when graphed, it makes a beautiful Gaussian curve.
But enough about my dependent variable - what about all those independent ones? This would take some more time.
Deciding on parameters is a kind of creative exercise. Some were pretty obvious: I knew question length and category were going to be in there in some way or another. But what about the questions that ended with a “Click here” link to external media? How about trying out some reading-difficulty tests?
Very quickly, I realized I had a problem. My best explanatory feature - the defense score, which is the average number of points players assigned to the question - wouldn’t be available to someone trying to predict the difficulty of a currently active question. Nor would the answer length, or the forfeit rate, or a few other parameters I had wanted to include. I was essentially trying to use future data to predict the future - like predicting who will win a baseball game using the number of hits scored in that game.
This was particularly bad, since that single defense parameter was (naturally enough) highly correlated with question difficulty, and was responsible for most of the power of my early test models.
I spent a while in the “bargaining” stage of grief, thinking I would have two models: one with only the ‘valid’ parameters, and the other with everything. But in the end I couldn’t come up with a defensible reason to use the with-everything model.
In the end, I wound up with the following list of features:
- Length of question (in characters)
- Category (18 categories, aggregated into four groups: ‘pop culture,’ ‘unpopular culture,’ ‘STEM,’ ‘humanities’)
- Category difficulty (overall % correct rate for each category)
- Question has media (attached image or sound file)
- Day of week question was asked
- Question text:
- Flesch-Kincaid reading score
- Dale-Chall reading score
- Average Scrabble-tile score (are Qs* and Zs hard?)
- Average Unicode integer value (are non-Latin characters hard?)
- Asks to “name any” of a list of possible answers
- Asks to “name all” of a list of answers
Some of these are obviously more plausible predictors for question difficulty than others. Day of week, for example, shouldn’t make a difference - LL isn’t like the New York Times crossword puzzle, with increasing difficulty from Monday to Friday. And it seemed unlikely that counting the Scrabble score or Unicode value of the question could help me that much. But it couldn’t hurt to try.
regress to impress
Linear regression is a workhorse of data science (and statistics in general).
You can use it to predict the value of a single continuous variable using any number of inputs, given that certain assumptions about your data is (generally) true. Since I’m trying to find out the difficulty of a trivia question (a continuous and approximately normal variable) from a whole mess of both continuous and category (dummy) variables, OLS is the model for me! (Also, it’s required by the assignment.)
Unfortunately, after eliminating all my very predictive and very cheating future-information covariates, my model was… pretty terrible, with an R² of under 0.08. And to be honest, if you think about what I’m trying to do here (estimate a fuzzy quality like “question difficulty” from a handful of only somewhat relevant facts), it shouldn’t be a big surprise that this didn’t really work.
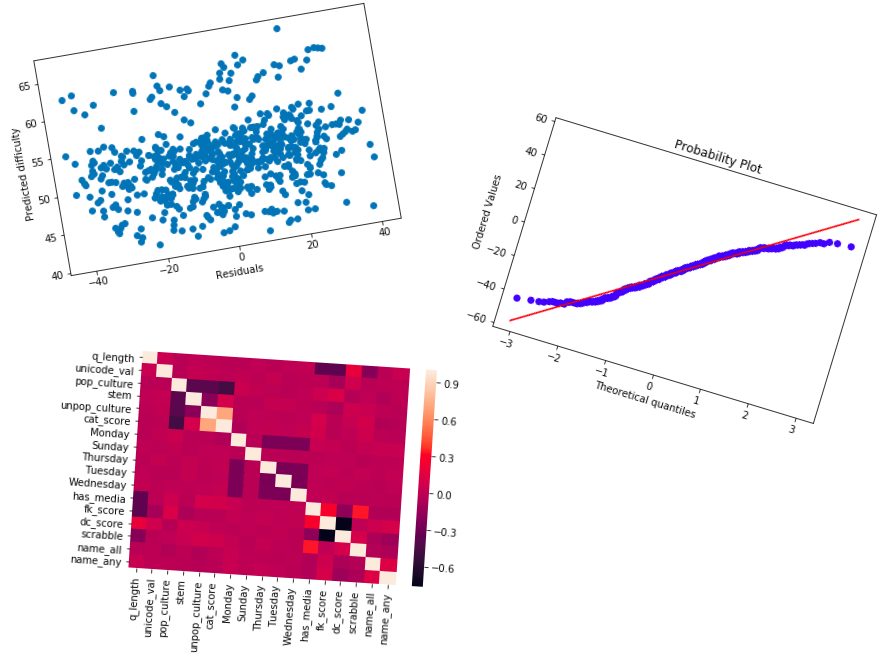
On the plus side, my tests of OLS assumption validity all came out great!
By this point I’d added all the variables I could think of. Maybe it was time to take some out?
yeehaw
Saddle up, cowboys and cowgirls, it’s time for LASSO! That’s right, I’m talking about the Least Absolute Shrinkage and Selection Operator! The Lasso method adds penalties to the cost function for each coefficient, so that the model is “punished” for each additional feature. This can actually help the model, because dropping features can reduce the variance (‘vagueness’) of a model, without necessarily adding a proportional amount of bias (‘wrongness’). Even better, the scikit-learn implementation of Lasso can iterate through a range of multipliers, find the best one through cross-validation, and show which variables ended up not contributing to that model.
I ran Lasso on my data, and it helpfully decided that about half of my features were useless garbage. My category group dummies (like “pop culture” were zeroed out, as was the Scrabble tile score and the Flesch-Kincaid score (although the Dale-Chall score was retained). Also, all of the day-of-the-week dummies were rejected, except, weirdly, for Tuesday. Tuesday questions were slightly easier.
Running my OLS regression again using only the selected variables, my R² went up! Very slightly. The model was still pretty awful. Graphing predicted vs. actual question difficulties, you can see why:
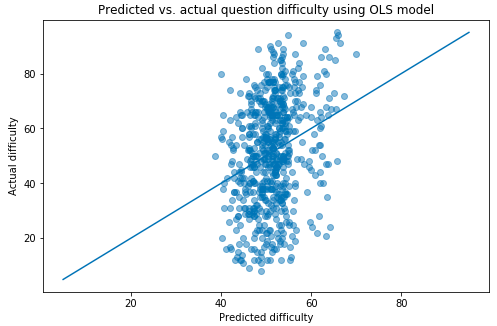
The model is only predicting values between about 40% and 70% difficulty, even though the range of the actual data runs from 2% to 96%. That’s not great! And, looking at the coefficients for my variables, it makes sense - the most important feature, by a long shot, is category score, which is the average league-wide correct percentage rate of each of the 18 question categories. That only varies from 38.3% (classical music) to 56.8% (current events), with most of the category scores falling around the middle of that range, so there’s only so much the model can do with it.
so what
Of course, I was never intending to actually use this to help me play LearnedLeague, because using outside resources is strictly forbidden, and cheating is bad. In any case, I doubt it would help me much. But I did take a few things away from this experience:
- Web scraping is fun and easy to do, given a consistently formatted site and the right tools (Beautiful Soup,
pandas.read_html). - The best datasets are the ones you collect yourself, because you know what everything is and why it’s there.
- The worst datasets are the ones you collect yourself, because you can’t blame anyone else for your problems.
- Models aren’t magic. You can’t get blood from a stone, or accurate predictions from a grab bag of random features. (Regularization is sort of magical, though.)
- You probably need serious NLP deep learning dark magic to actually do something like this.
And if you’ve made it this far, hit me up if you want an LL referral. No cheaters.
-
If you’re curious: the easiest question, and the hardest. Actually, this one is tied for hardest, and happens to be one of my favorite questions ever asked on LL. ↩